
Overview
SmartInsights allows you to explore your data using natural language questions.
Instead of navigating multiple reports or filters, you can simply ask a question and get an immediate response in the form of:
- A written summary of the results
- A data table with relevant details
- A chart or visualization (when applicable)
It’s designed for fast, flexible exploration of learner and performance data. You don’t need to ask the perfect question to get started. Begin broadly, explore the results, and refine as you go.
Getting Started
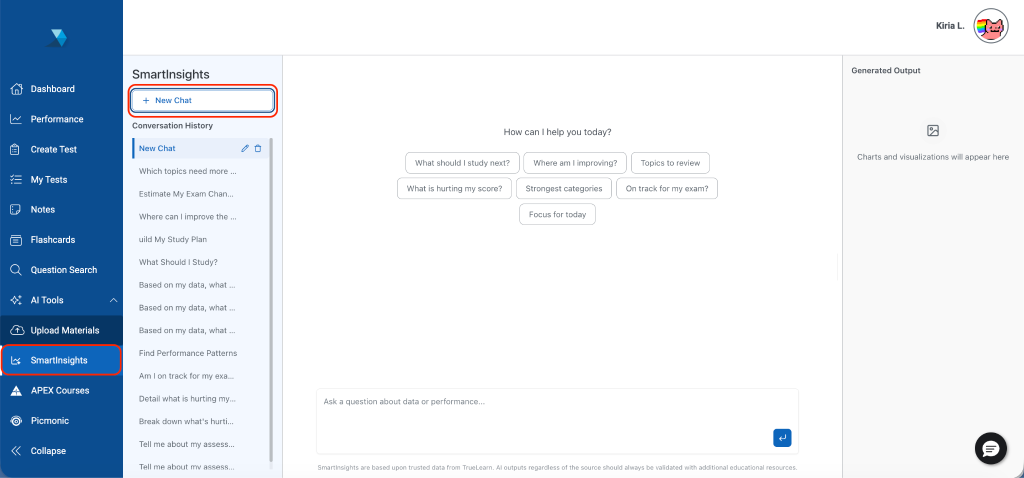
Access SmartInsights:
- Log in to TrueLearn
- Navigate to AI Tools in the left-hand menu of the Dashboard
- Select SmartInsights
Exploring Insights
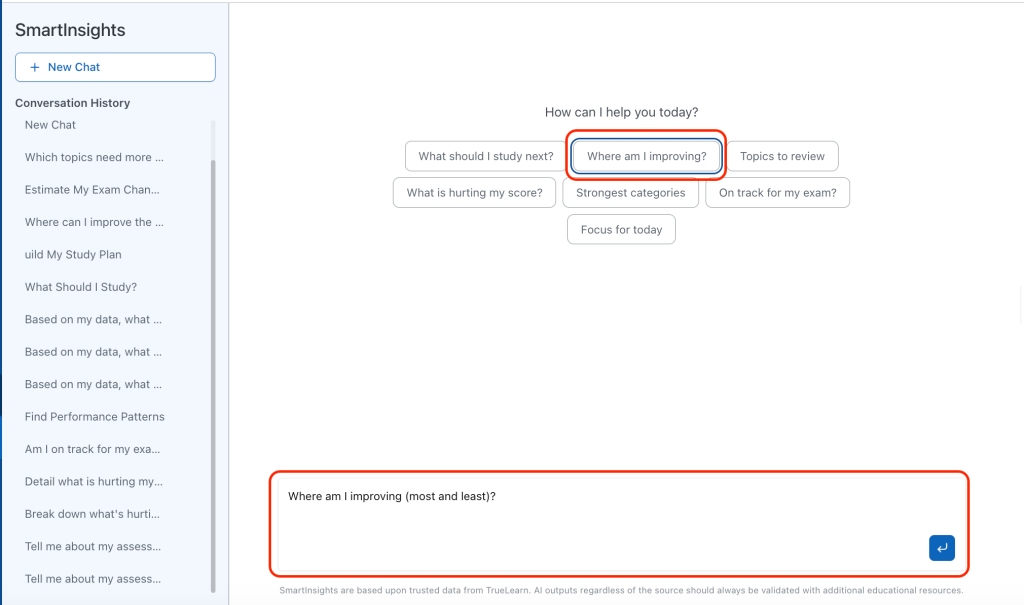
To get started, type a question in the input box and press Enter.
Sample Queries for Exploration:
- What trends are showing up in my performance?
- Which areas should I focus on the most right now?
- What’s holding my score back?
- Where can I make the biggest gains the fastest?
- How do my study habits compare to top-performing students?
- What should I study next?
- Can you build a study plan that fits my needs?
Surfacing Data:
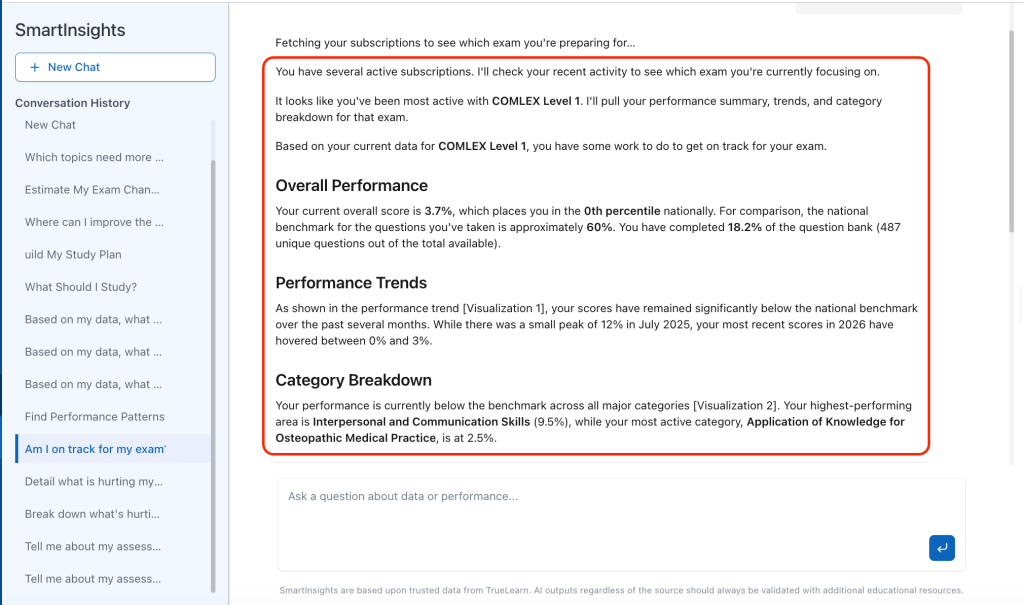
Each SmartInsights response may include one or more of the following components:
Summary:
- A plain-language explanation of what the data shows and key takeaways.
Data Table:
- A structured breakdown of results (e.g., learners, performance metrics, activity data).
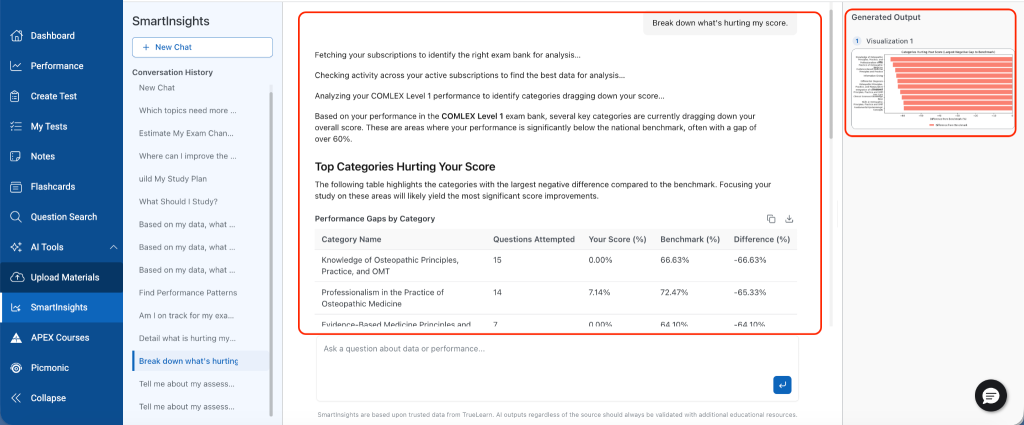
Chart (when applicable):
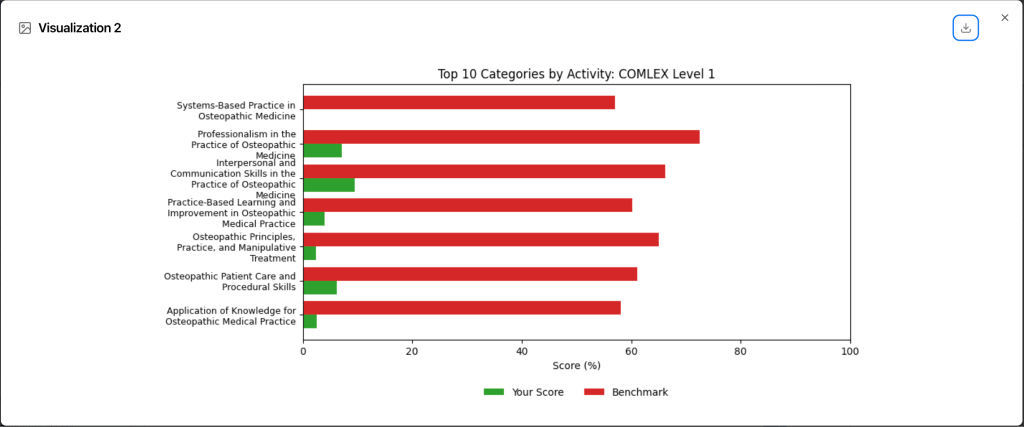
- A visual representation of trends, comparisons, or distributions.
Exploring Your Data
SmartInsights is designed for conversational, iterative analysis. You don’t need to ask the perfect question to get started.
Many users begin with a broad question, review the results, and continue exploring through follow-up prompts.
Example workflow:
- What trends are showing up in my performance?
- Which areas should I focus on the most right now?
- What’s holding my score back?
As you explore, you can:
- Add more context
- Compare time periods
- Drill into categories or cohorts
- Request additional details or groupings
- Shift focus based on emerging patterns
This flexible approach helps uncover insights.
SmartInsights vs. Performance Dashboard & Reports
SmartInsights helps you explore your performance data through conversation. You can ask questions, investigate trends, and uncover insights in real time.
When to Use SmartInsights vs. Performance Dashboard & Reports:
- SmartInsights and the Performance Dashboard & Reports are complementary tools designed for different types of workflows.
Use SmartInsights when you need exploratory analysis
SmartInsights is best for ad hoc questions, rapid investigation, and uncovering patterns and making discoveries you may not have anticipated.
Examples:
- Understand your performance
- Find your biggest opportunities
- Learn from top performers
- Get personalized study guidance
As with all performance data, use these insights as a starting point and discuss results and next steps with your faculty, advisor or learner specialist.
Use the Performance Dashboard when you need structured reporting:
The Performance Dashboard is best for standardized, repeatable, and validated reporting.
Examples:
- Tracking performance trends over time
- Monitoring category or exam performance
- Comparing your performance to national benchmarks
- Deep analysis with consistent metric definitions
Rule of Thumb:
- SmartInsights is for asking questions you didn’t plan ahead for where flexibility is important to accomplish user goals. .
- The Performance Dashboard is for standardized reporting and ongoing tracking where flexibility is not as essential.
Important Note:
SmartInsights and Performance Dashboard & Reports use the same underlying data. However, SmartInsights relies on natural language interpretation, so results may vary slightly depending on how a question is phrased.
For high-stakes reporting, official reviews, or external-facing data, always validate results using your Performance Dashboard.
SmartInsights enables faster discovery by making data exploration conversational, flexible, and iterative.
Frequently Asked Questions — SmartInsights
Q: What is SmartInsights in TrueLearn?
A: SmartInsights is an AI-powered tool that lets you ask questions about your data in plain language and get instant summaries, tables, and charts without needing to build reports manually.
Q: How is SmartInsights different from the Performance Dashboard?
A: SmartInsights is best for fast, flexible, ad hoc questions and exploration. The Performance Dashboard is best for standardized reporting and consistent metrics.
Q: Do SmartInsights results use real TrueLearn data?
A: Yes. SmartInsights uses the same underlying data as the Performance Dashboard. However, results may vary slightly depending on how a question is phrased.
Q: Why didn’t I get a chart with my results?
A: SmartInsights automatically chooses the format that best fits the question. Trend-based questions may generate charts, while detailed operational questions may return tables or summaries.
Q: How do I get better results from SmartInsights?
A: Begin with a general question and continue refining your analysis through follow-up prompts. For example, start with “show inactive users,” then add “include names and last login date” or “only COMLEX Level 1.”
Q: Can SmartInsights give me answers to Tests, Quizzes or Assessments?
A: While SmartInsights can access performance metrics, topics, and tags for your completed tests, the TrueLearn Data Bot does not have the access to actual text of questions or the correct answer choices. This information is kept secure within the TrueLearn platform to maintain the integrity of the exam banks.