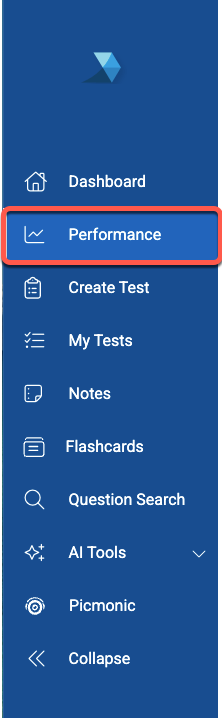
Navigation
When logged into your TrueLearn member account, you will see a navigation menu on the left hand side of your screen. Click on the “Performance” tab to access your performance data.
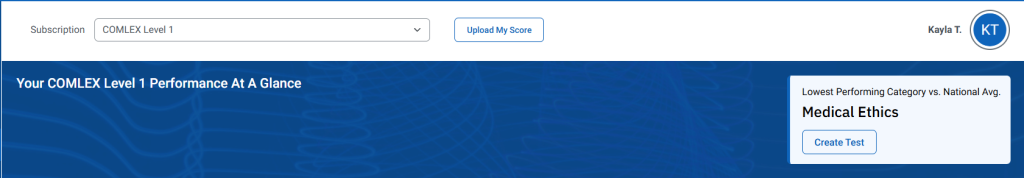
Subscription Filter:
Using the drop down menu at the top of the page, select the subscription you would like to view performance data for. Please note, you can view data for both active and expired subscriptions.
Performance at a Glance:
Once the subscription has been selected, you will see a snapshot of your performance “At a Glance” for that subscription. You will also have the ability to Create a Test from your Lowest Performing Category vs. National Average.
Filters Section:
To hone in on specific data available, update your filters.
Time Period – This filter shows your performance for the selected time period. You can select YTD, Last 30 Days, Last 7 Days or enter a selected period manually.
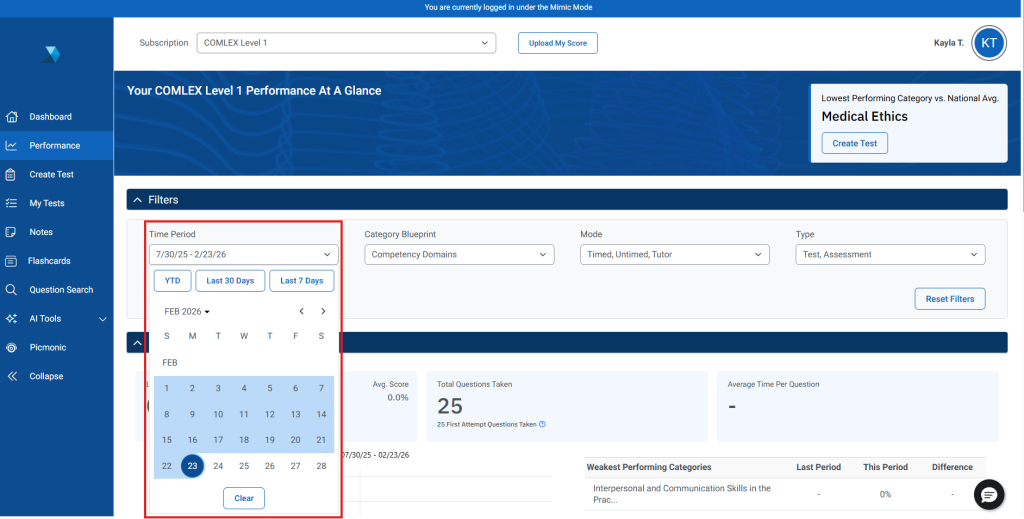
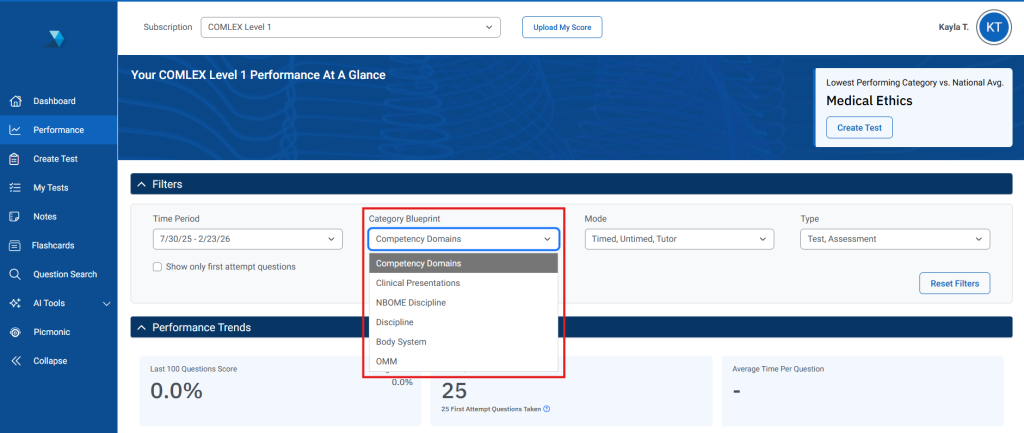
Category Blueprint – This filter shows your performance for the selected category blueprint.
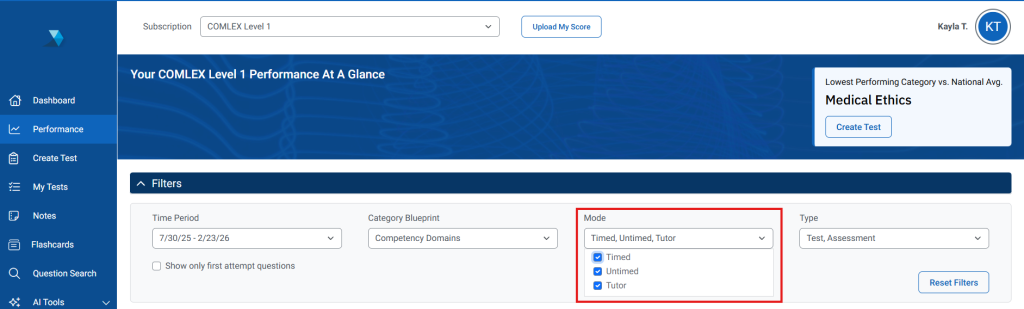
Mode – This filter shows your performance for Timed, Untimed and Tutor Mode. Use the checkboxes to select the mode(s) you would like included.
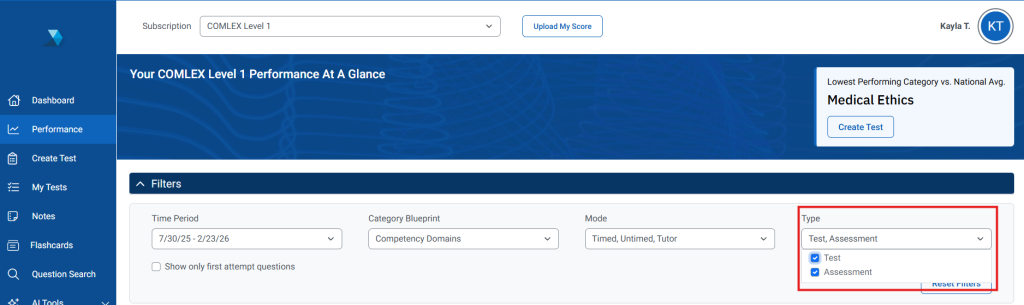
Type – This filter shows your performance for your different tests types
- Self created Tests,
- Faculty Assigned Quizzes (if applicable)
- Mock Assessments (if applicable)
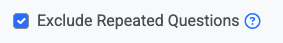
Exclude Repeating Questions – Select this check box if you would like to only include the data for your first recorded attempt for questions taken.
Filter Behavior:
- Filters update all charts and tables simultaneously. The selected filters will be applied to all data on the performance page.
- If you navigate away from the Performance page, the selected filters will persist when you return to the page.
- To return to the default filters, select Reset Filters.
Performance Trends:
Once your filters have been selected, the data in your performance dashboard will update. The Performance Trends data is broken into three sections: Performance Trend Cards, Average Score Trend Graph, and Strongest/Weakest Performing Table
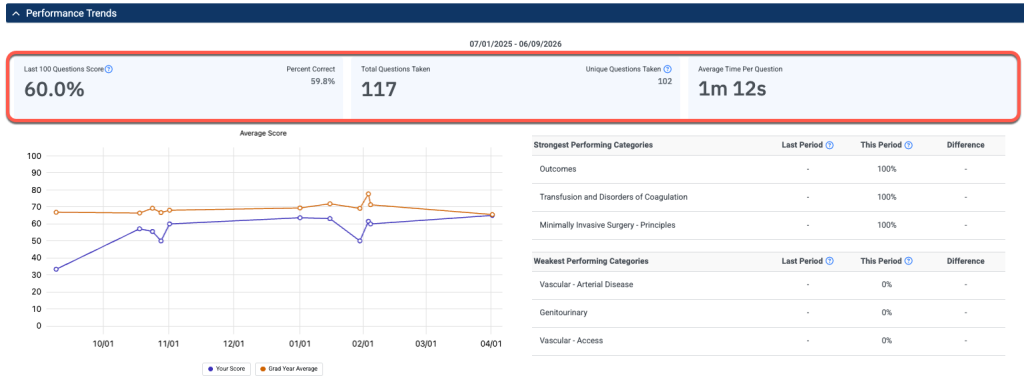
Performance Trends Cards:
- Last 100 Questions Score – This card displays the average score of your 100 most recent questions. This card will also display the average score of all questions taken to the right under Percent Correct.
- (Note: if you have not taken 100 questions, you will see the percent correct of the questions that have been taken. This number will match the total Percent Correct score until more than 100 questions have been taken.)
- Total Questions Taken – This card displays the Total Questions Taken and Unique Questions Taken (the count of questions taken only once).
- Average Time Per Question – This card displays your average time to answer a question.
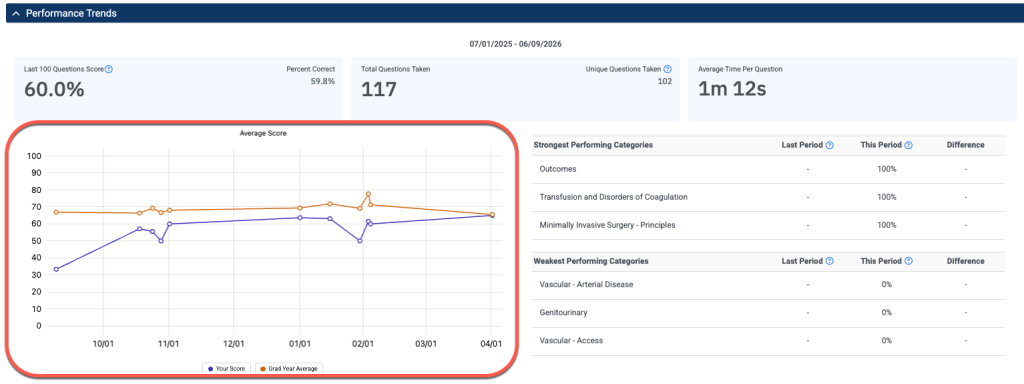
Average Score Graph:
The Average Score graph displays your overall performance and allows you to compare it to various available benchmarks (if applicable), such as National Average. The benchmark shown is the benchmark chosen within the filters. You can toggle the benchmark data on or off by selecting the benchmark name at the bottom of the graph.
This helps you quickly understand how your results measure against broader benchmarks.
Strongest and Weakest Performing Categories Table:
The Strongest Performing Categories and Weakest Performing Categories are displayed in two tables highlighting your three highest performing and lowest performing categories based on average score.
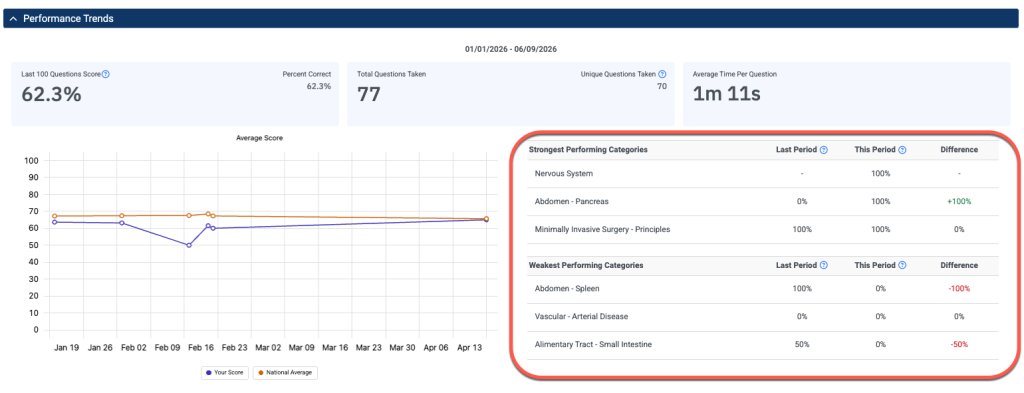
Table Columns:
- Last Period – Displays the average score from the equivalent time period immediately preceding the Time Period selected in your filters.
(Example: If “Last 30 Days” is selected, this column reflects the 30 days prior to that range.) - This Period – Displays your average score based on the selected Time Period filter.
- Difference – Shows the percentage change between Last Period and This Period.
- Positive difference → Displayed in green
- Negative difference → Displayed in red
- No change (0%) → Displayed in the default text color
- Missing data → Displayed as “–”
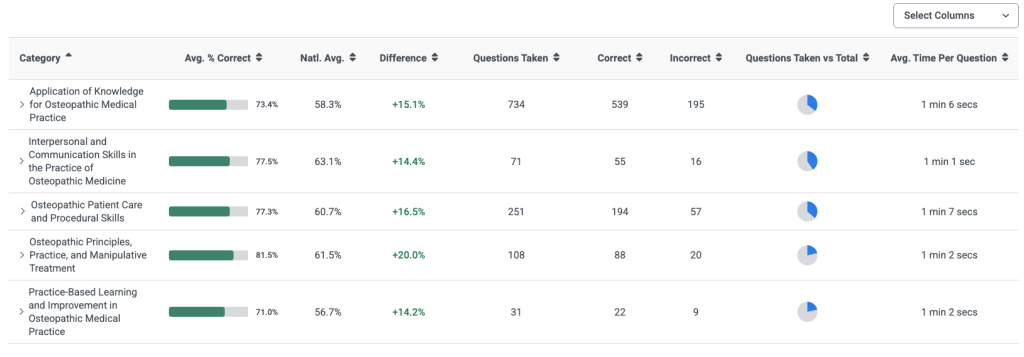
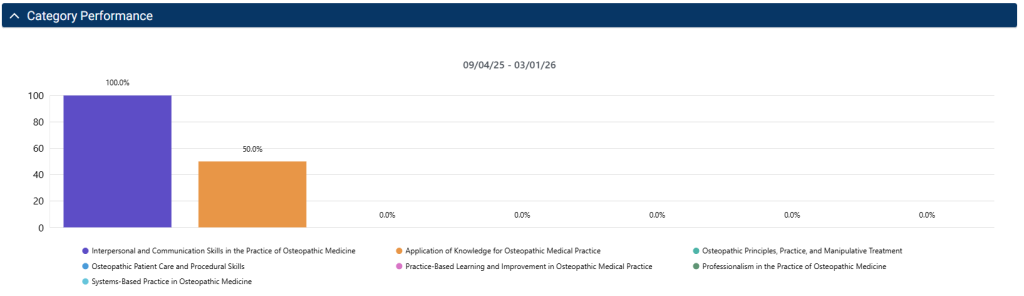
Category Performance:
The Category Performance section displays performance broken down by category using a bar graph and a table.
- Bar Graph:
- The bar graph will provide you with a visual display of your average score in the listed category. Hover over the graph to view the category name and your average score. To remove a category from the graph, simply select the category name from below the graph.
- Table:
- The category performance table will display the following:
- Average Percent Correct: Your average percentage correct for all questions taken in this category.
- National Average: The Average for this category for all users who have taken questions in that category.
- Difference: The difference between your Average % correct and the National Average.
- Questions Taken: Total questions taken in that category.
- Questions Taken vs Total: Shows the number of questions you have taken in comparison to the number of questions available in that category. Hover over the chart to view detailed values.
- Average Time Per Question: This is the average amount of time spent on a question in that category.
- The category performance table will display the following:
*Note: you can click “Select Columns” on the top right to adjust the columns pulling into the table.