Overview
TrueLearn is committed to providing a world-class product that prepares students to become strong life-long learners inside and outside of the classroom. A key part of our data-centric approach is to communicate comparative benchmarks for students to gauge their preparedness.
The TrueLearn Comprehensive Exam Readiness Model provides an estimated probability of a student passing the real-world standardized exam, COMLEX-USA® Level 1, based on performance on the mock assessment combined with longitudinal study behaviors. This prediction is only visible if enabled by the institution.
It is designed as a decision-support tool to help educators, students, and advisors assess exam readiness. However, the predicted probability should not be interpreted as a guarantee of success or failure, but rather as an indicator of likelihood based on historical test-taking patterns and learning behavior.
Please note, this model is only available for learners whose institution has opted into using this new model. Please refer to our score prediction models if this has not been enabled by your institution.
Introduction
The Assessment Summary Report tells you how you performed on your TrueLearn mock assessment. Your report provides you with key insights about how you performed overall, by question, and by category. In this guide, you will learn how to read and interpret the data reflected in this report. Additionally, you will learn how to use these data to identify areas on the assessment where you underperformed. By identifying areas for improvement, you can better target your future studies to make the best use of your time.
Before Taking Your Assessment
It is very important that you keep the following guidelines in mind when taking your mock assessment. Following these guidelines will improve the accuracy, validity, and usefulness of the data provided by the Assessment Summary Report. First, you should treat your mock assessment as seriously as you would your real-world exam. Give it the same effort and diligence you would give to your real-world exam. Second, you should take the mock assessment under conditions that most closely mimic the real-world exam (e.g., no study materials, complete the mock assessment in one sitting under timed conditions, etc.). Finally, you should take your mock assessment as closely as possible to when you will sit for your real-world exam.
Summary Cards
The Summary Cards are the first set of data you should review after opening your assessment summary report. These summary cards provide you with a quick overview of how well you performed on your assessment and how your performance compares with other learners. Let’s now walk through each summary card to help you understand what it’s telling you.
1. Interpretation Guide: How to Read Your Results from the Summary Score Card
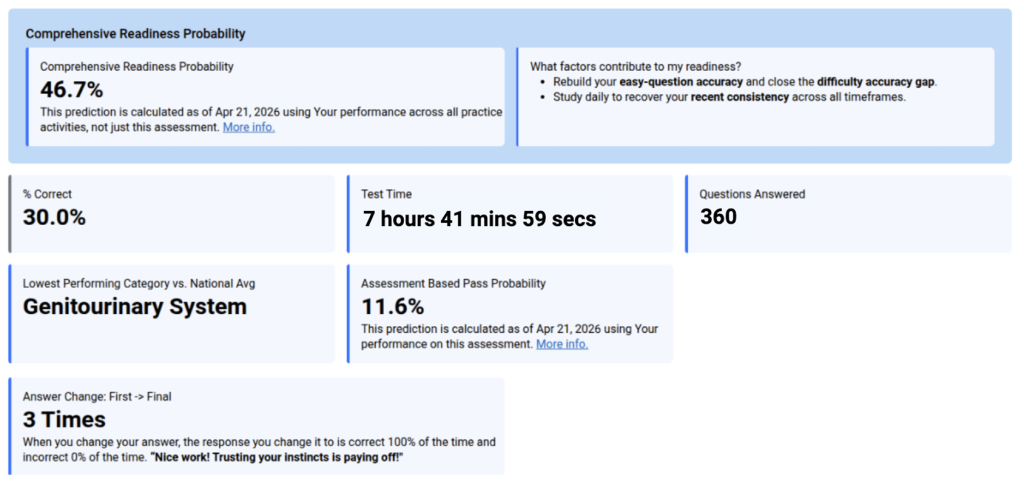
Figure 1. Summary Cards from a COMBANK Level 1 Assessment Summary Report for a sample mock assessment.
- Comprehensive Exam Readiness Probability Score (%): This is the combination of your current Mock Assessment performance plus all of the longitudinal behavioral features discussed in section 2, below. This percentage is our best prediction of your Exam Readiness as of today. The percentage represents the probability of passing based on the Mock Assessment and behavioral features. More details can be found here.
- % Correct: This is your raw accuracy (percent correct). Specifically, it is the percentage of questions you answered correctly on questions in this specific Mock Assessment. A score of 57.7%, for example, means you answered 57.7% of the questions correctly on this attempt. The Percent Correct score gives you a baseline for your understanding and mastery of the content on your assessment. The higher your score, the more you understand the material. If your score is lower than expected, you will want to identify the material where you require the most improvement. It is suggested that you review the Question Performance and Category Performance tables of your report to help you identify your weakest areas to target additional study for improvement.
- Test Time: This is the total active time you took to complete the Mock Assessment.
- Questions Answered: This is the number of questions answered for the Mock Assessment.
- Lowest Performing Category vs National Avg tile tells you which topical category you answered incorrectly compared to national averages. It gives you a snapshot of your least performing category.
- Assessment-Based Pass Probability Summary card reports your pass probability for COMLEX Level 1 based on your performance on the current assessment relative to others taking the same questions. The details of how the score is calculated can be found here.
- The Insights Summary Card gives you a quick overview of what behavioral factors you can focus on to improve your scores. If you hover over the bold terms in the insights tile, you will see the definition of the terms so it is clear what you can focus on. These insights are limited basic performance data and a plethora of behavioral information from the TrueLearn platform that assess your study behaviors over your time on the platform in any form( tutor mode, quizzes, etc.) and how they might affect your score. Below we have listed out all of the relevant terms you might see in the Insights tile.
2. Understanding The Relationship Between Percentile Correct and Comprehensive Exam Readiness Score
When reviewing the score cards, in some cases your Percentile Correct Score and Comprehensive Exam Readiness Score may show discrepancies in how high or low your score is, or disagree with regard to a pass or fail. If there is a mismatch, and just in general, we recommend relying on the comprehensive pass probability. It is generally a more accurate predictor of exam readiness than the assessment based probability alone. . Here are some things to keep in mind when looking at these scores.
- If your comprehensive exam readiness score prediction predicts a “pass” and your assessment based score also predicts a “pass” score for the mock assessment, you are likely to pass with the probability outlined in the Comprehensive Exam Readiness Pass Probability.
- If your comprehensive exam readiness score prediction predicts a score of “fail” and your assessment based prediction also shows a failing score for the mock assessment, you are not likely to pass with the probability outlined in the Comprehensive Exam Readiness Pass Probability.
- If your comprehensive exam readiness prediction is lower than your assessment based score: The model is correcting for “False Confidence”. It has detected behavioral risks (like “Panic” or rushing) that make your raw score less unreliable. The comprehensive exam readiness prediction has demonstrated to be more accurate.
- If your Comprehensive exam readiness prediction is higher than your assessment based prediction: The model is rewarding your Resilience. Your strong habits suggest you are more prepared than a prediction based on a single test score implies.
3. Understanding the Model: Exam Readiness with a Focus on Learning Behavior
Research shows that a single Assessment based probability score is a snapshot in time, and it does not capture the full picture of a student’s habits, stamina, or mindset that work together to determine a student’s exam readiness.
The Comprehensive Exam Readiness Prediction Score is prompted when a student takes a mock assessment. Based on your current mock assessment score and longitudinal engagement with the TrueLearn Platform, we provide you with an estimated pass probability. Our Readiness Score engine utilizes over 144 distinct variables that are all based on the current Mock Assessment score as well as “Learning Behavioral Forensics” that get to the how and why behind your performance. This approach helps identify where your behavioral characteristics have an impact on your readiness beyond just the knowledge check the mock assessment provides. This can help you identify whether you have high knowledge but are still at high risk (e.g., due to panic or inconsistency), or if you have a lower mock assessment score but possess the resilience to pass.
How the Exam Readiness Prediction Score Works
The Exam Readiness Prediction Score is designed to give you a clear, trustworthy picture of how prepared you are for exam day. Rather than relying on a single metric, the score looks at patterns across multiple aspects of learning and study behavior. Together, these signals help distinguish short-term performance from true readiness.
At a high level, the model evaluates nine key dimensions:
- Overall performance and accuracy over time: The score looks at how a learner performs throughout their entire study journey, not just at one point in time. This includes how accuracy changes as learners progress and how they perform on questions of different difficulty levels. This matters because steady improvement tells a very different story than early success followed by stagnation.
- Study behavior and response patterns: Beyond whether an answer is correct, the model considers how learners approach questions over time. Patterns such as pacing and response behavior help signal confidence and familiarity with the material. These behaviors often reveal mastery sooner than accuracy alone.
- Study cadence and scheduling habits: The model pays attention to how consistently learners study. Regular, spaced study sessions are strongly associated with long-term retention, while irregular or last-minute bursts often indicate weaker preparation.
- Overall activity and engagement: This dimension looks at overall participation and commitment to studying. Learners who stay engaged over time tend to develop deeper understanding and are better able to apply knowledge under exam conditions.
- Strengths and weaknesses by question difficulty: Not all mistakes carry the same meaning. The model examines how learners perform across easier and more challenging questions. Missing simpler questions can be a stronger warning sign than struggling with the most difficult ones, which helps identify risk areas more accurately.
- Peer and cohort context: We have a number of variables that are based on how students rank compared to their peers based on activity on the platform. The score compares a learner’s progress to that of similar students within their institution, providing context that reflects the specific curriculum and learning environment.
- Recent momentum and trends: The model looks closely at what’s happening as the exam approaches. Learners who are improving near the end of their study period often perform better on exam day than those whose performance is declining, even if overall accuracy looks similar.
- Study mode and testing context: How learners practice matters. Performance in more exam-like conditions—such as timed or proctored settings—tends to be more predictive of real exam outcomes than practice modes designed purely for learning or exploration.
- Combined and interaction signals: Finally, the model evaluates how different patterns interact. Certain combinations of behaviors can indicate states like fatigue or test anxiety, which may not be obvious when looking at any single metric in isolation.
Together, these dimensions allow the Comprehensive Exam Readiness Prediction Score to move beyond simple “percent correct” measures and provide a more holistic, realistic view of preparedness—helping you focus your time where it matters most and approach exam day with greater confidence.
Once you have reviewed and learned how to read and interpret the Summary Cards to holistically assess your performance on your assessment, you should focus your review on identifying the material where you underperformed. The Time Per Question visualization, Question Performance table, and Category Performance table will help you to discover your weakest areas where you should target your review. These tools help you identify where to focus your study time to maximize improvement. For additional information on the available visualizations, click here.